RESOURCES
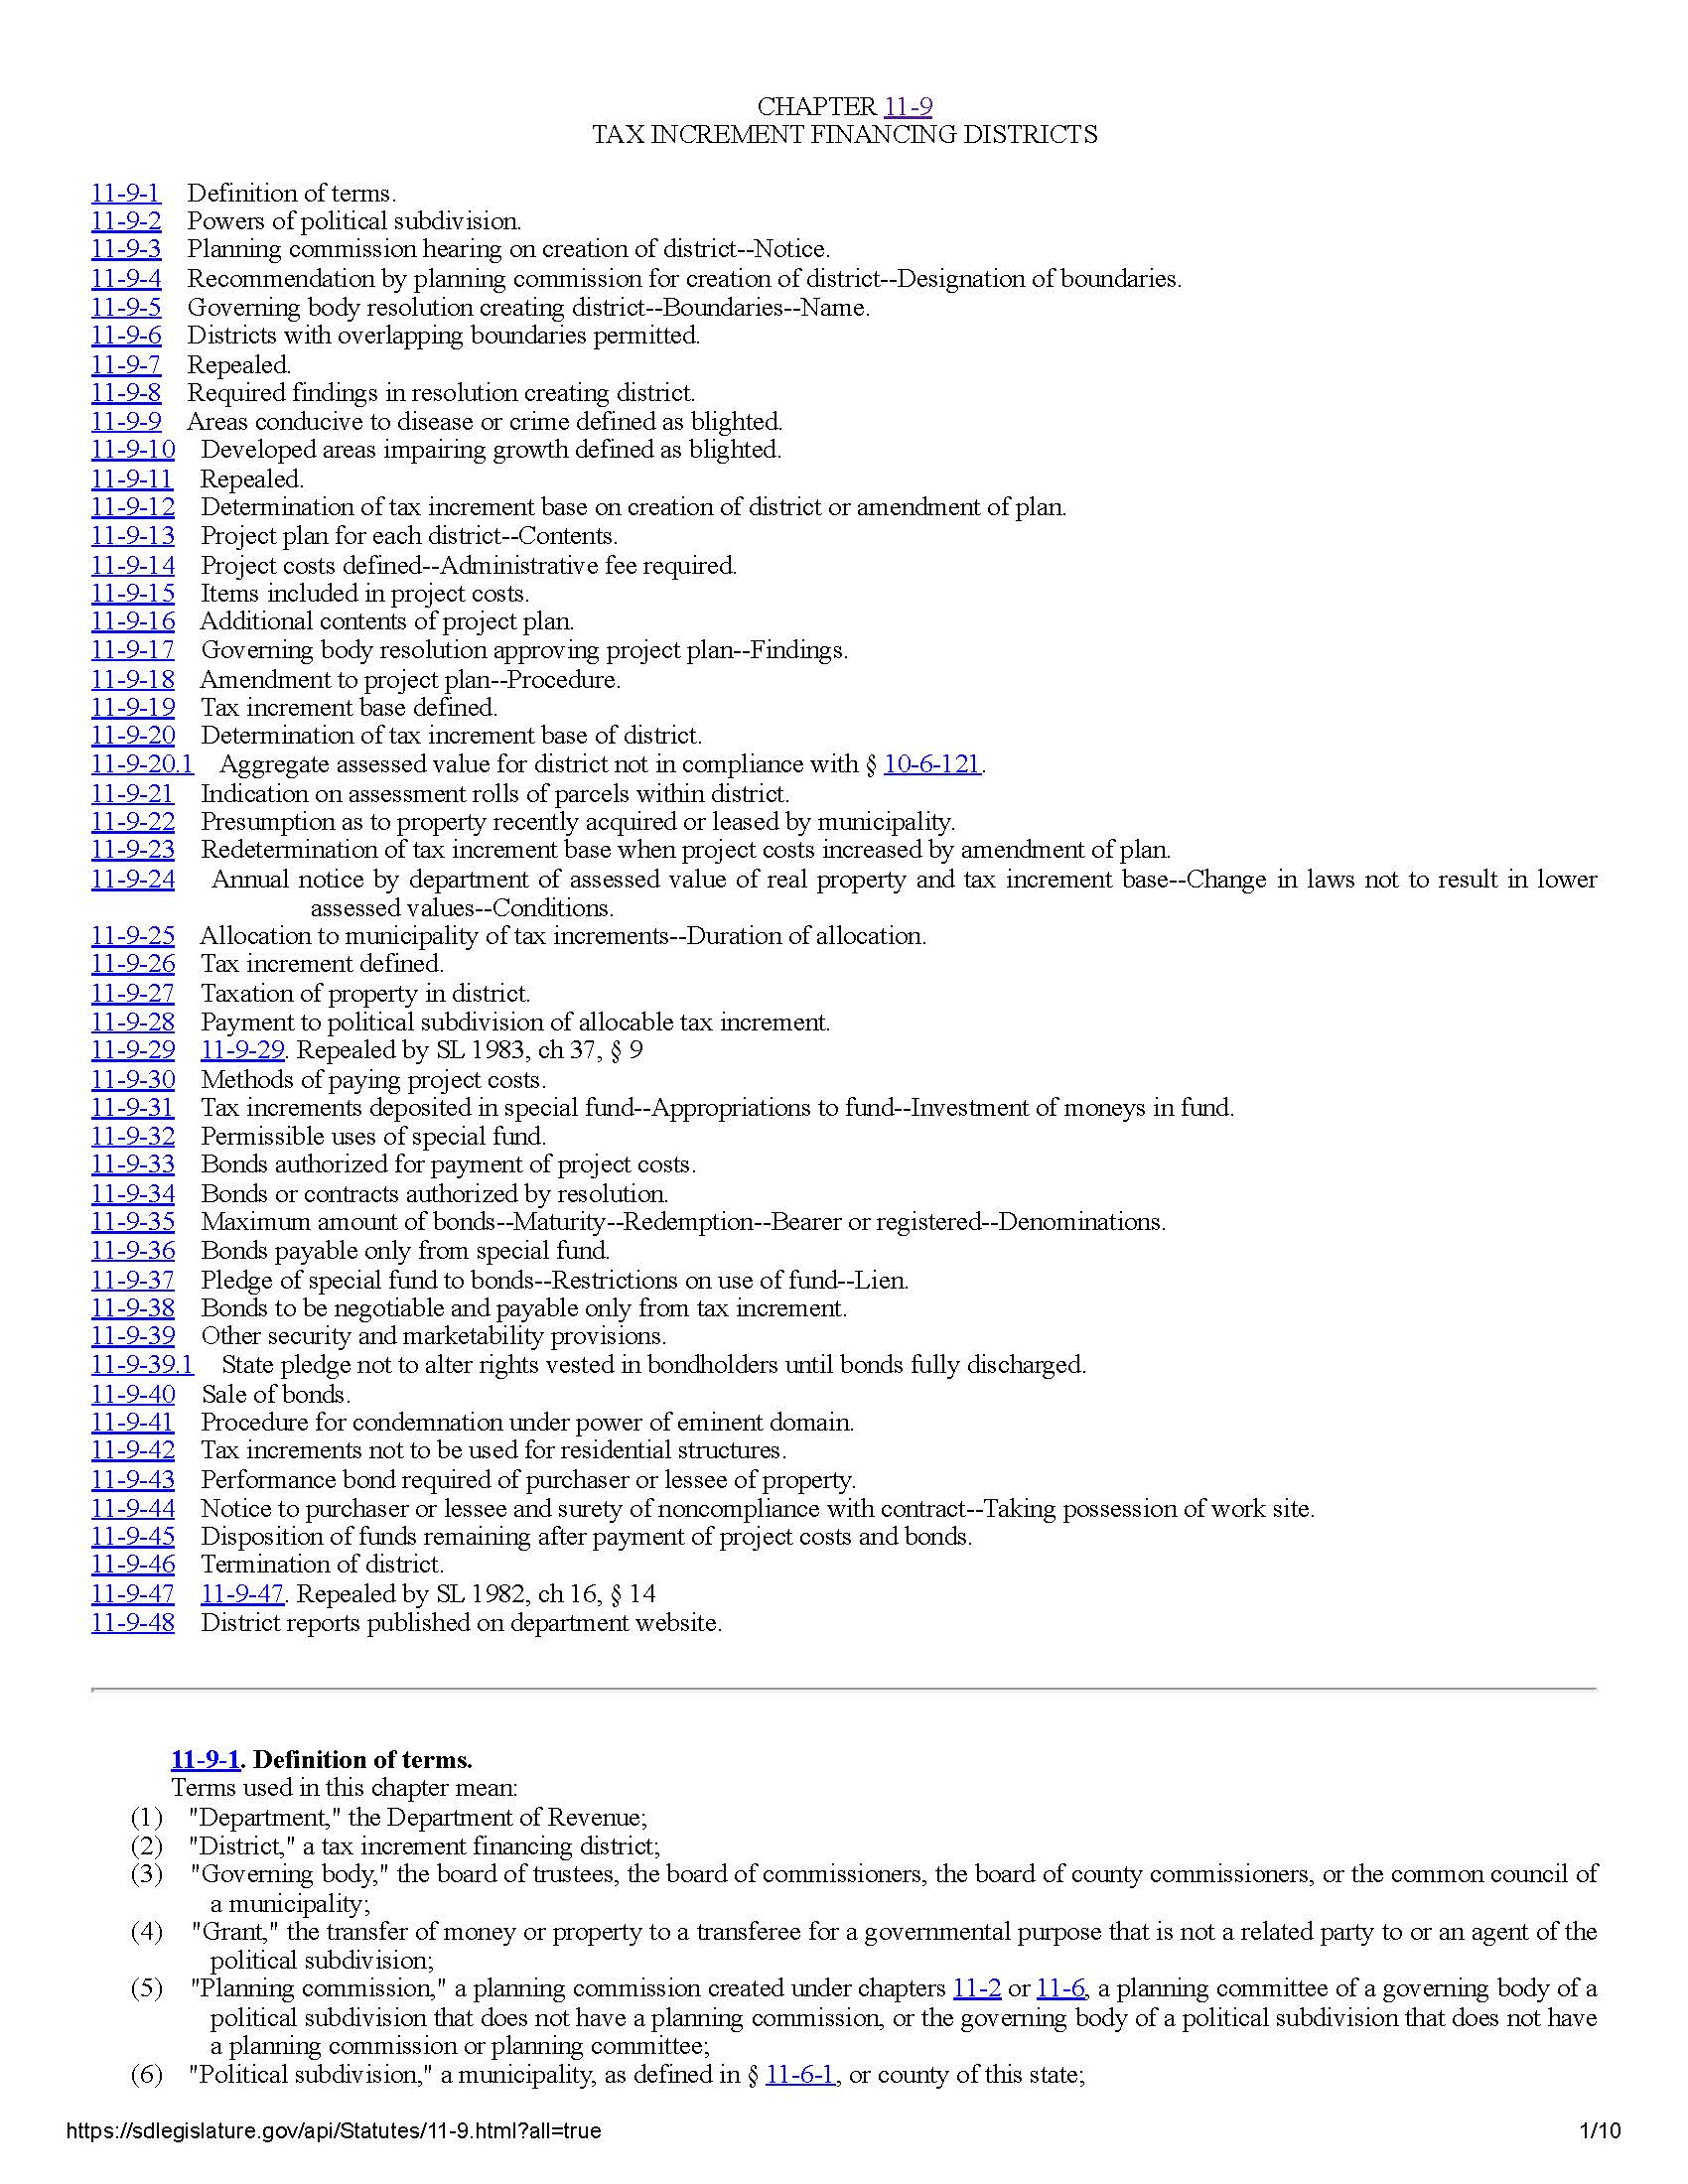
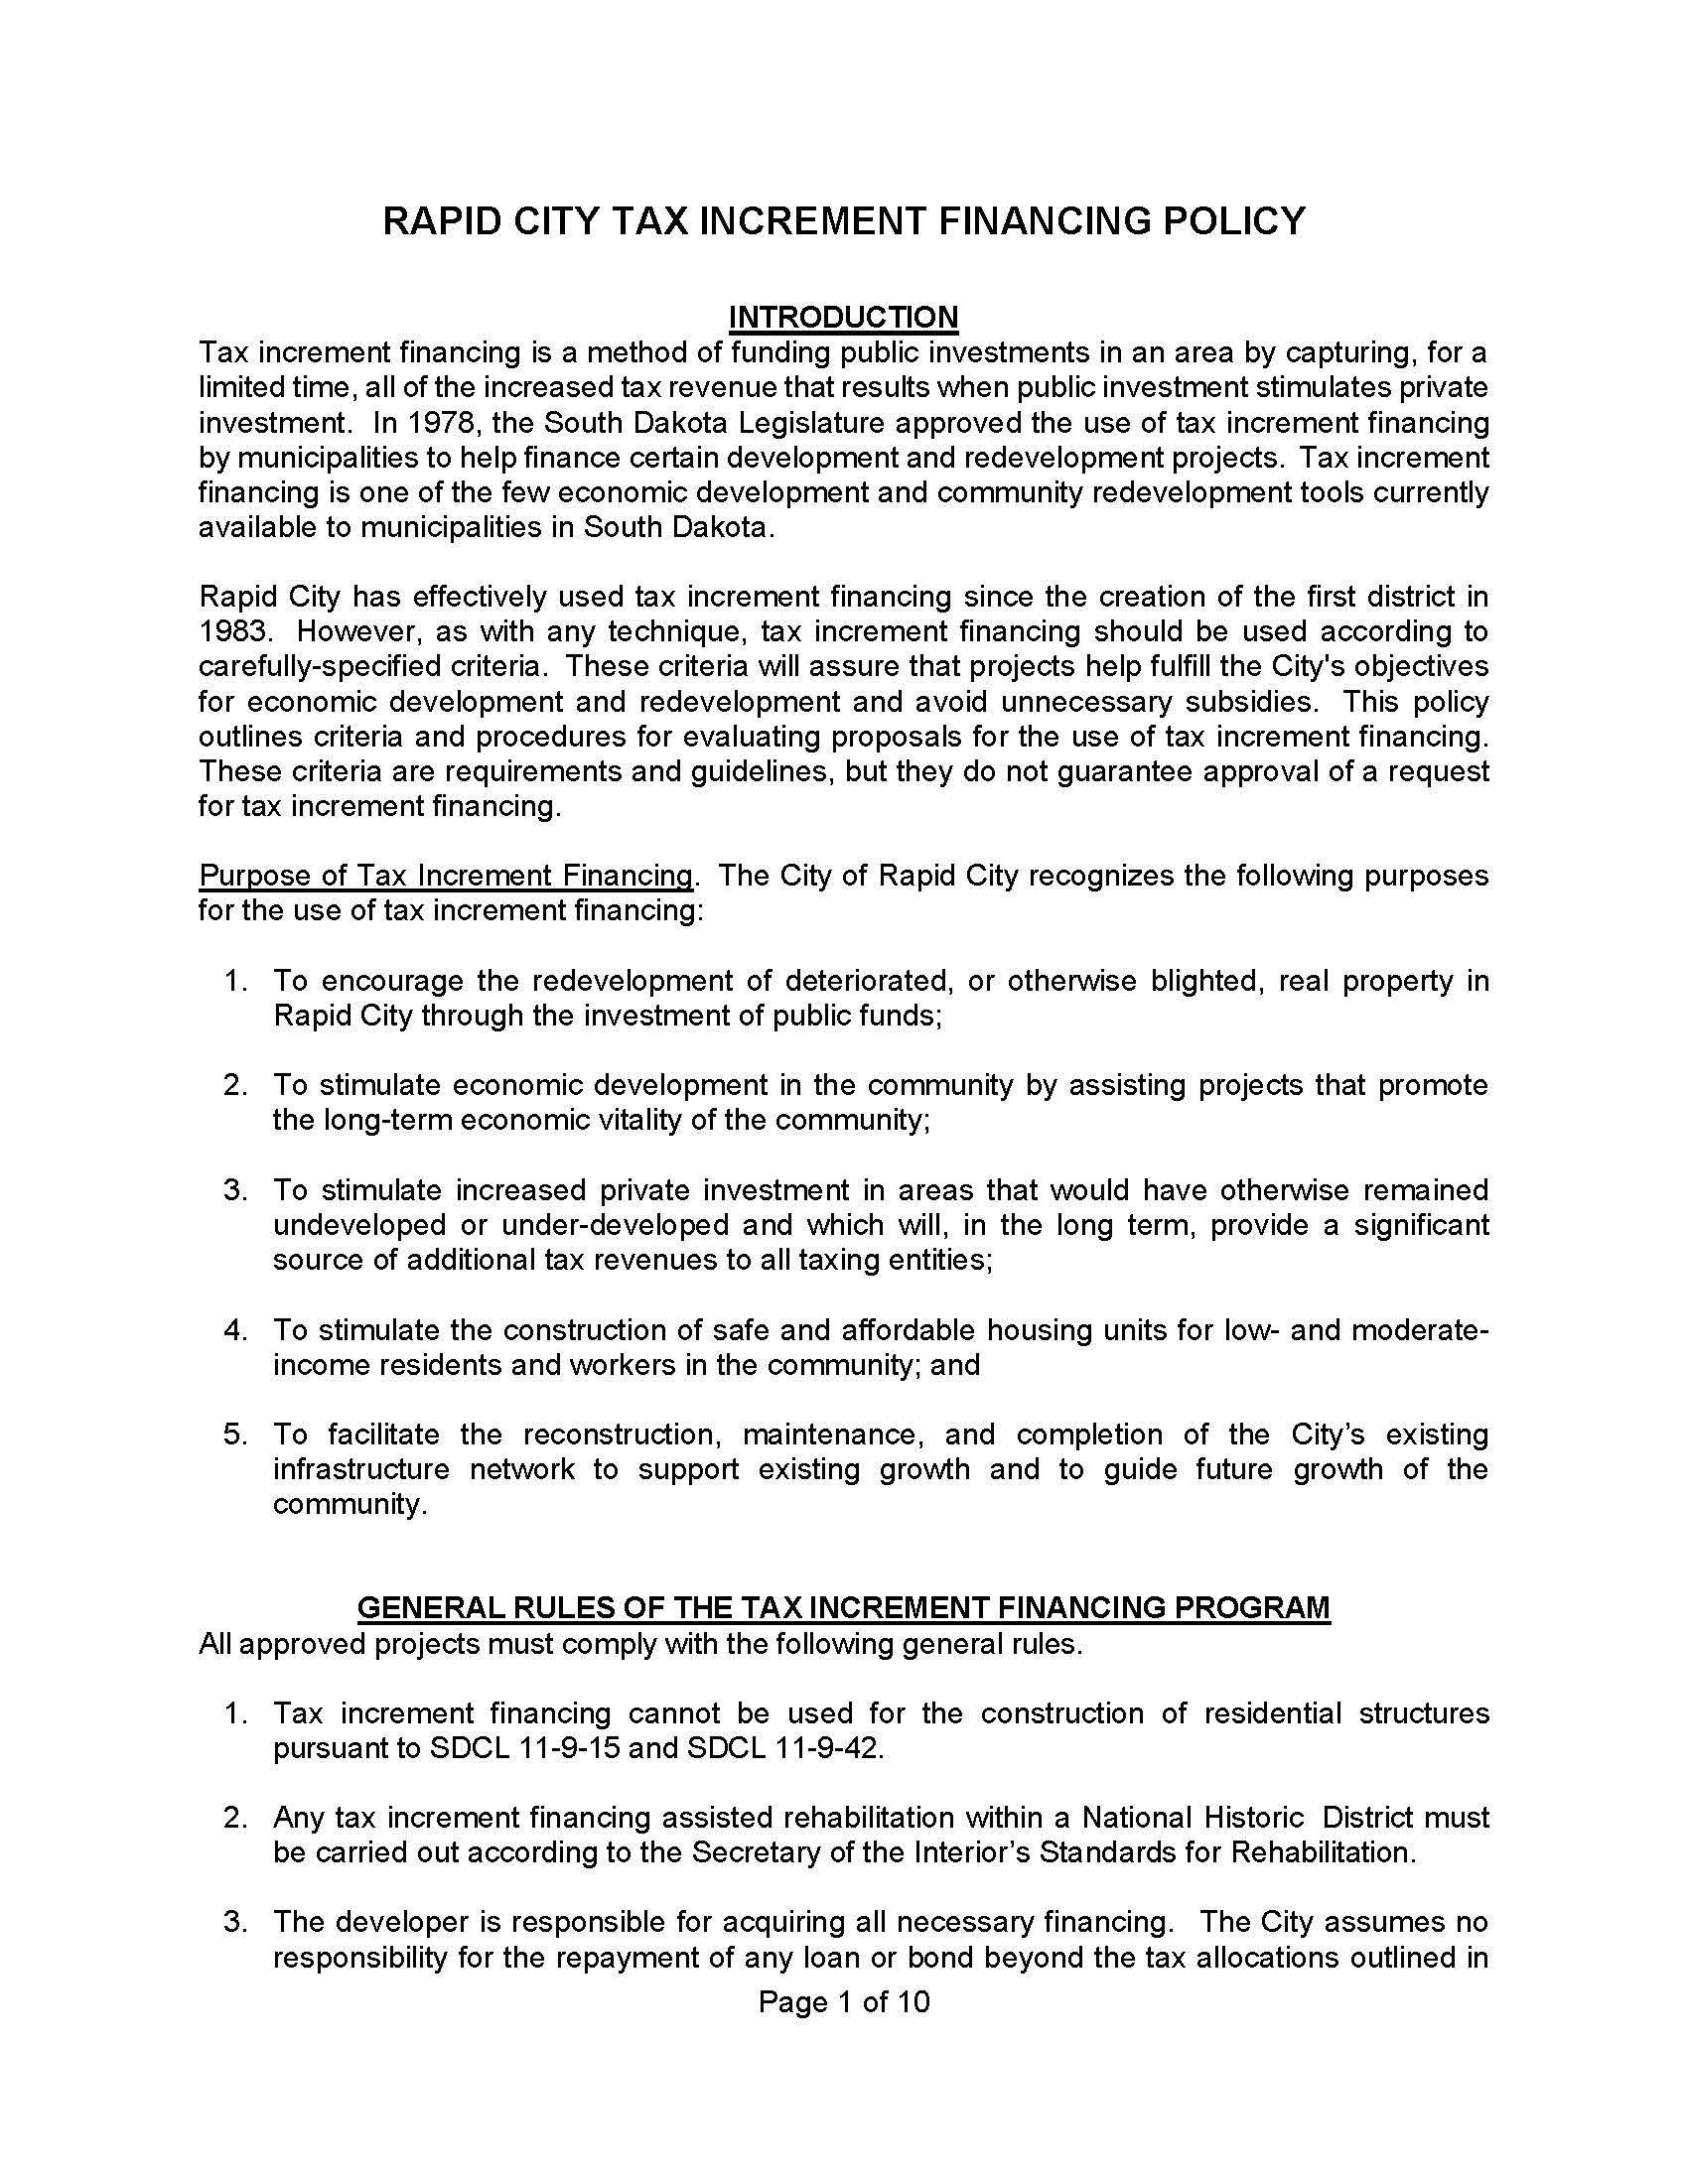
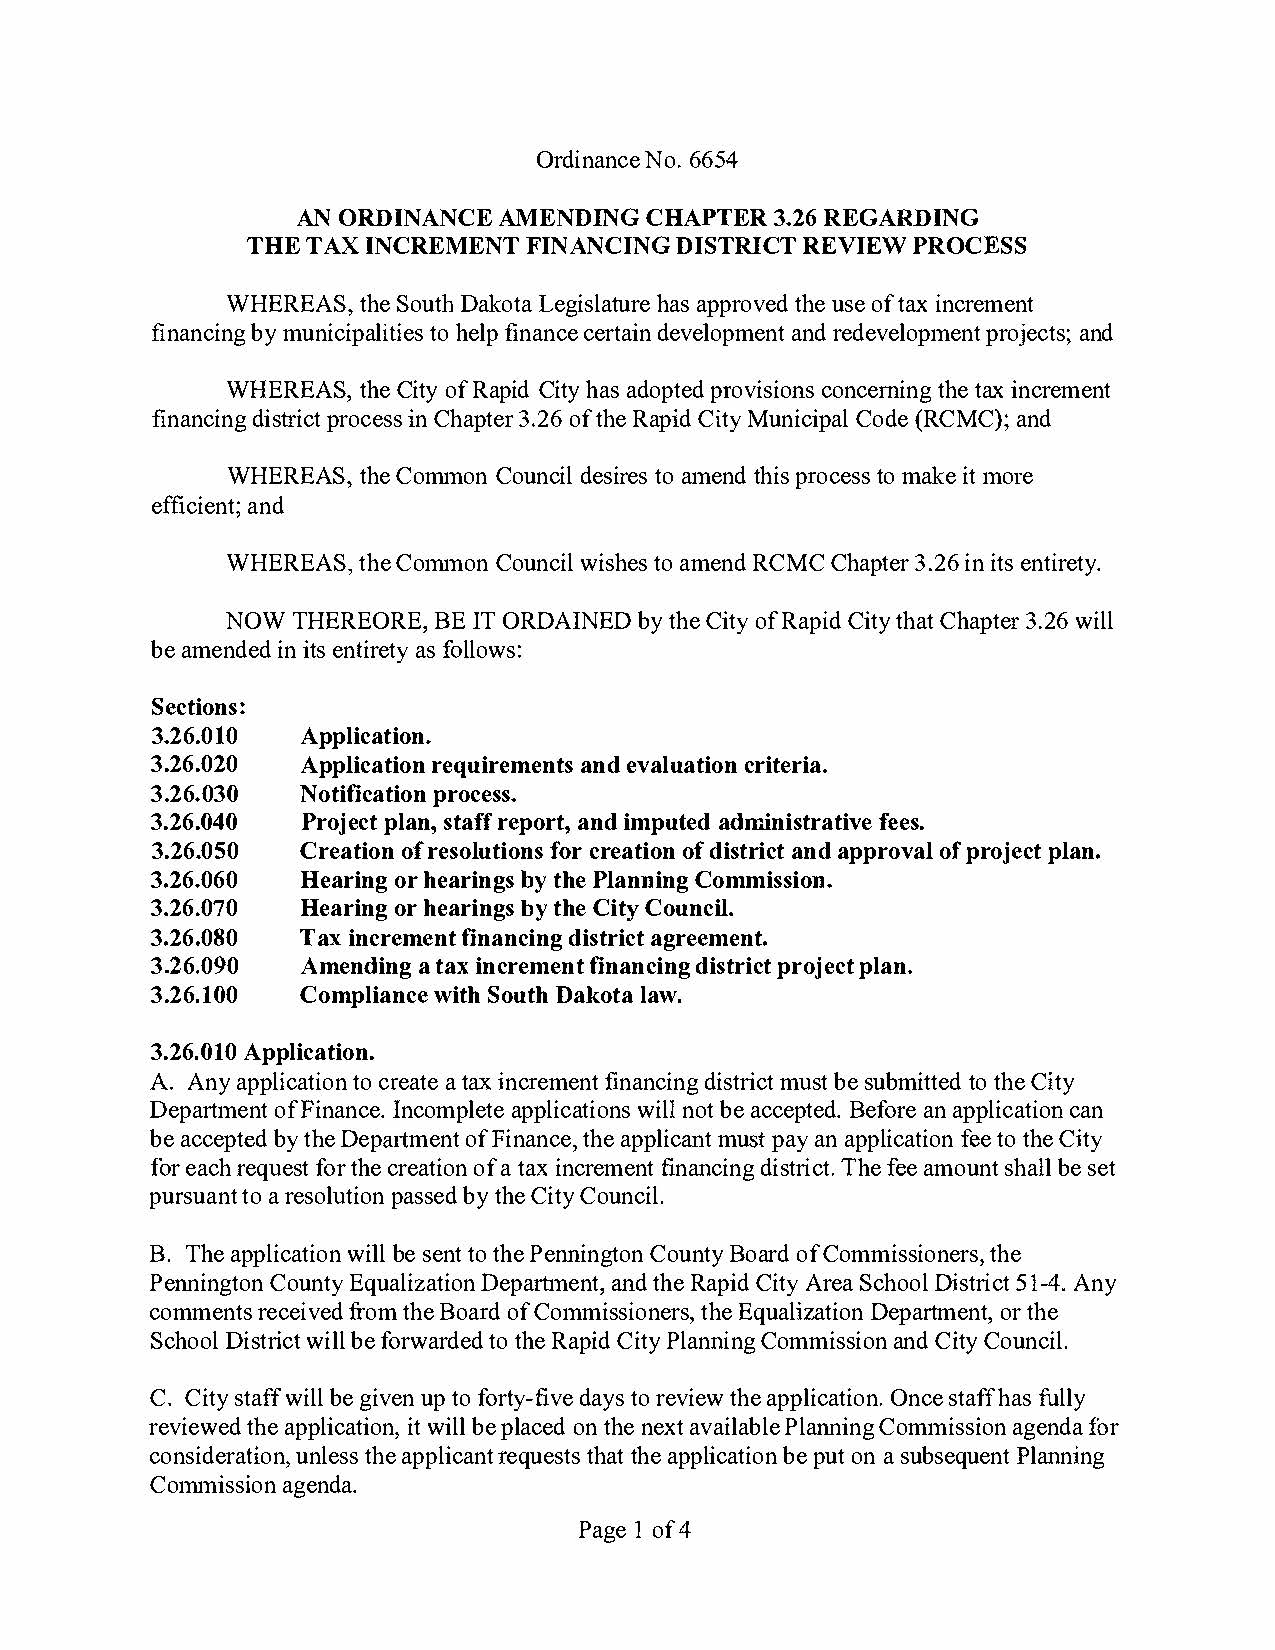
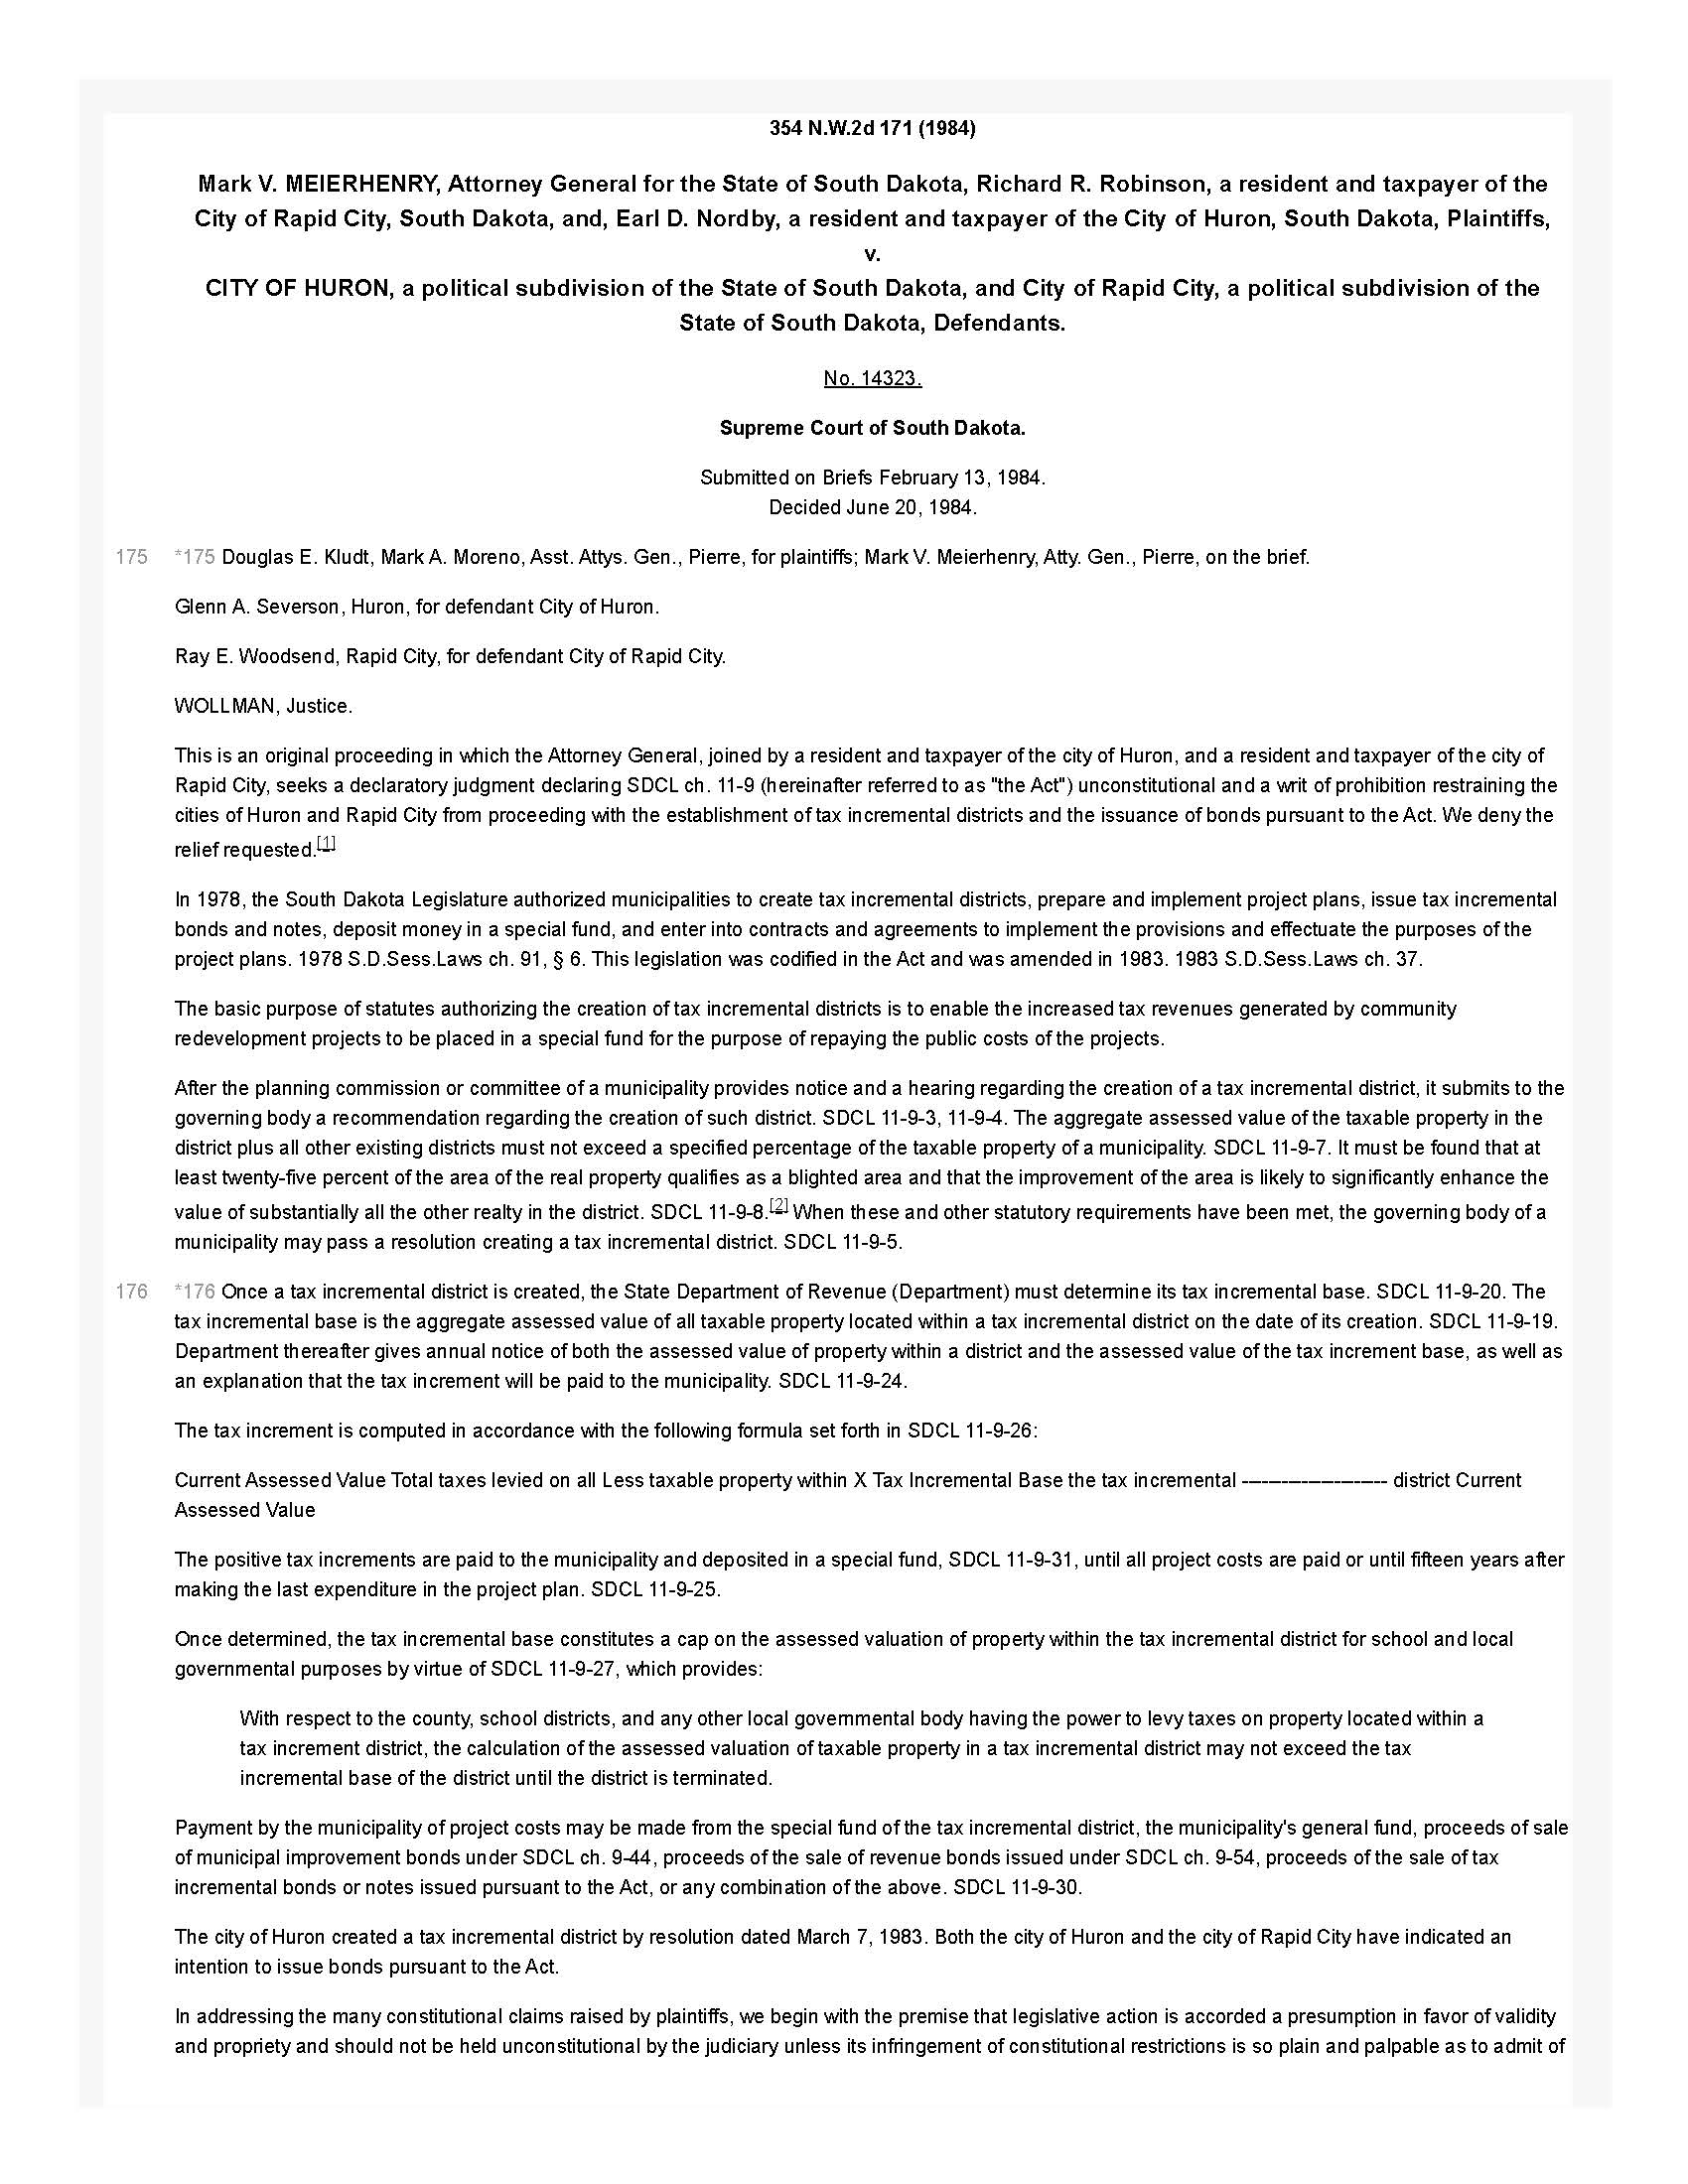
LEARN MORE ABOUT THE STATE LAW, POLICY AND RELATED ITEMS
LAWS & POLICIES
After charting the lifespan and valuations of each Tax Increment Financing District (TIFD), these summary figures bring the full picture into focus. On average, TIFDs saw a 2,476% increase in value, reflecting the long-term growth that these projects captured. When adjusted for the number of years each district was active, that translates into an average annual growth of 249%—a measure of how quickly those gains accumulated over time. Taken together, the total captured from all TIFDs studied amounts to nearly $650 million, underscoring the significant financial footprint these districts have had in reshaping local tax bases and development patterns.
RAPID CITY TIFD
%
Average TIFD Increase
%
Average TIFD Annual Growth
TOTAL CAPTURED FROM TIFD
The timeline below traces the creation and lifespan of each TIFD. By showing when districts were formed and how long they remained active, it highlights both the steady expansion of TIFDs over the years and the variation in how long each one lasted before closing.


